
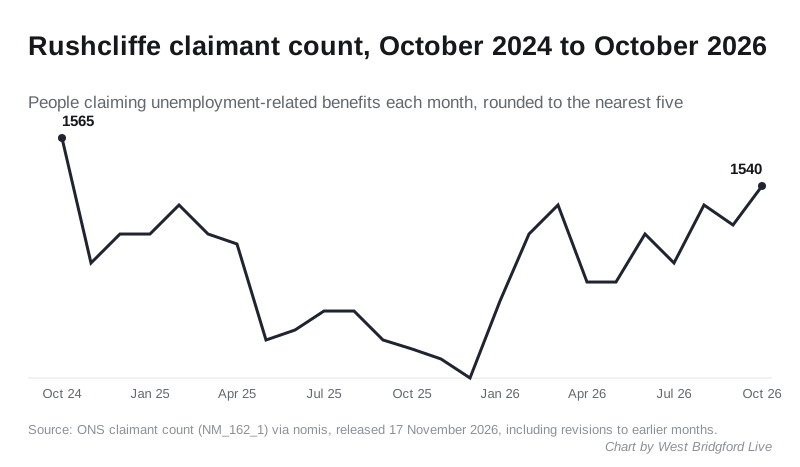
Rushcliffe's claimant count rose to 1,540 in October, the highest since October 2024. Under-25s and men account for most of the rise of 85 in a year.
The number of people claiming unemployment-related benefits in Rushcliffe rose to 1,540 in October. That is 20 more than September and 85 more than a year ago.
It is the borough’s highest monthly figure since October 2024, when it stood at 1,565. The Office for National Statistics published the October figures on 17 November. (ONS claimant count via nomis)
Rushcliffe is still the lowest of the seven Nottinghamshire districts, at 2.0% of residents aged 16 to 64.
What the numbers say
- 1,540 people claiming in October 2026
- up 20 on September, as revised
- up 85, or 5.8%, on October 2025
- 2.0% of 16 to 64 year olds, against 3.5% across the East Midlands and 3.9% in the UK
- up 100 from the two-year low of 1,440, in December 2025
September has been revised down
Last month we reported a September count of 1,550, as the ONS first published it. In this release the ONS revised September to 1,520.
So the count did not rise in September, as first reported. It dipped by 10 from August’s 1,530, then rose by 20 in October. Over the year the trend is still upwards.
Under-25s and men account for most of the rise
Compared with October 2025, the extra 85 claimants are not spread evenly.
| Age group | Oct 2025 | Oct 2026 | Change |
|---|---|---|---|
| 18 to 24 | 275 | 325 | up 50 |
| 25 to 49 | 810 | 830 | up 20 |
| 50 and over | 370 | 385 | up 15 |
Under-25s are the smallest group, but they account for 50 of the 85. Their number is up by almost a fifth in a year.
By sex, men rose from 765 to 840, up 75. Women went from 690 to 705, up 15.
The wards with the highest rates
The ONS also publishes the count for each of Rushcliffe’s 24 wards. Trent Bridge, the ward nearest the bridge itself, has the highest rate in the borough.
| Ward | Claimants | Rate |
|---|---|---|
| Trent Bridge | 80 | 2.9% |
| Edwalton | 110 | 2.8% |
| Radcliffe on Trent | 115 | 2.8% |
| Lutterell | 55 | 2.7% |
| Gotham | 35 | 2.5% |
| Keyworth and Wolds | 115 | 2.4% |
The lowest rates are in Soar Valley (0.7%), Tollerton (0.9%) and Nevile and Langar (1.0%). Cotgrave has the most claimants of any ward, at 120, a rate of 2.3%.
The eight wards that make up West Bridgford, Edwalton and Gamston have 640 claimants between them. That is about two in every five in the borough. Ward figures are rounded separately, so they add up to 1,545 rather than 1,540.
| West Bridgford ward | Claimants | Rate |
|---|---|---|
| Trent Bridge | 80 | 2.9% |
| Edwalton | 110 | 2.8% |
| Lutterell | 55 | 2.7% |
| Gamston | 90 | 2.3% |
| Abbey | 105 | 2.1% |
| Musters | 70 | 1.9% |
| Compton Acres | 60 | 1.6% |
| Lady Bay | 70 | 1.6% |
How Rushcliffe compares
| Area | Claimants | Rate |
|---|---|---|
| Rushcliffe | 1,540 | 2.0% |
| Newark and Sherwood | 2,110 | 2.8% |
| Broxtowe | 2,105 | 3.0% |
| Bassetlaw | 2,395 | 3.2% |
| Gedling | 2,430 | 3.3% |
| Ashfield | 3,060 | 3.8% |
| Mansfield | 2,770 | 4.0% |
| Nottingham | 13,950 | 6.0% |
Rushcliffe has both the smallest headcount and the lowest rate in the county. Nottingham, a separate unitary council, has about nine times as many claimants.
What this figure is, and is not
The claimant count is not the unemployment rate. The ONS says it “does not attempt to measure unemployment”. It counts “the number of people claiming benefits principally for the reason of being unemployed”.
Since Universal Credit, that includes some people in low-paid work who must look for more hours. A rise can reflect who has to claim, not only who has lost a job. (ONS, Claimant Count QMI)
Two more caveats:
- the figures are rounded to the nearest five, so a change of five or ten means little, and small wards move around from month to month
- earlier months can be revised, as September was this time
What it means for you
The borough figure covers West Bridgford, Bingham, Cotgrave, Ruddington, Keyworth, Radcliffe on Trent, East Leake and the villages.
- If you are claiming, Rushcliffe Borough Council’s benefits pages cover council tax support and discretionary housing payments. Those are separate from the jobcentre claim counted here.
- The November figures are due in the ONS’s next monthly labour market release, in December.
Sources
- ONS claimant count for Rushcliffe and its wards, via nomis, dataset NM_162_1, released 17 November 2026
- ONS, Claimant Count Quality and Methodology Information
Have your say