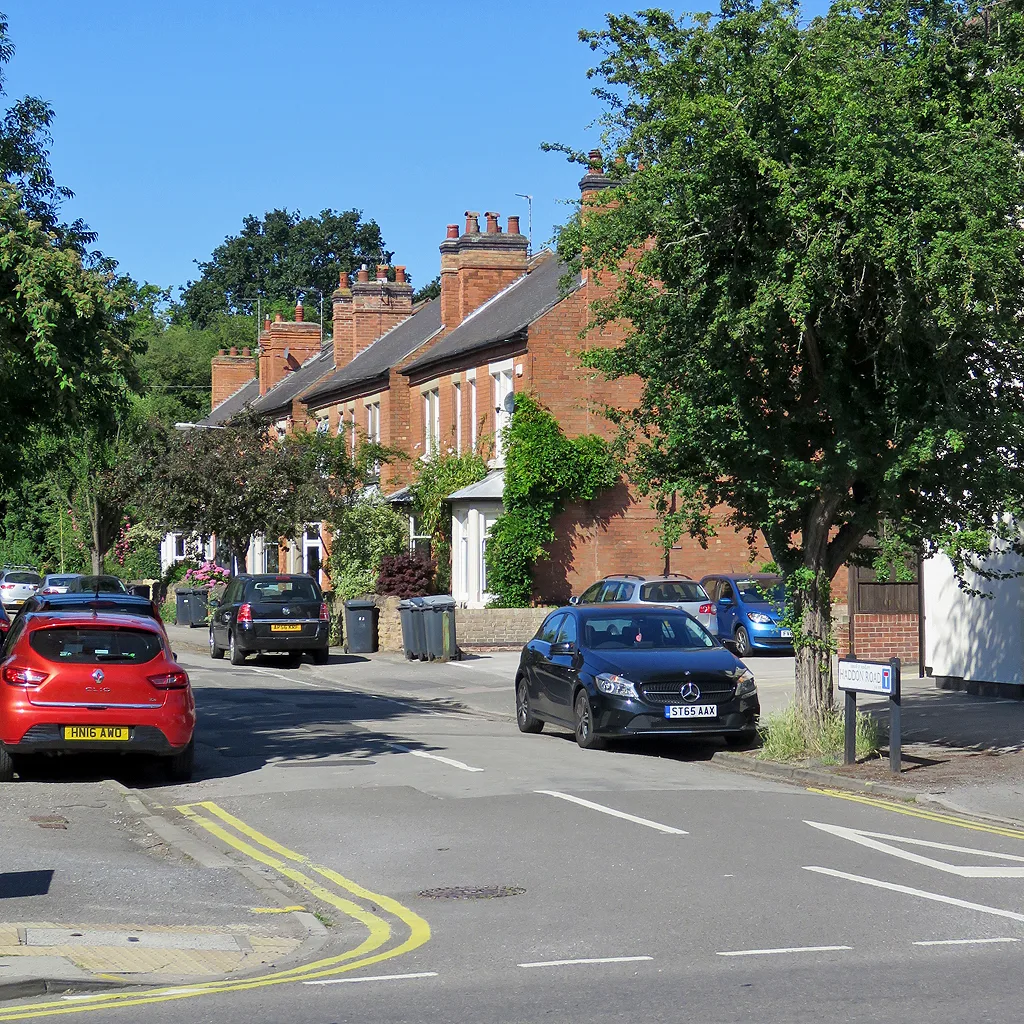

West Bridgford homes sold for a median £367,500 over the past year, well above the £324,012 Rushcliffe average. Sold prices by postcode area and property type.
Asking prices in the windows on Central Avenue are hopes. The number that counts is what homes actually change hands for, and every completed sale in England and Wales is recorded by HM Land Registry and published. This page reads those records for West Bridgford and for the rest of the Rushcliffe borough around it.
One thing to fix before the numbers. Most published figures for this area are borough figures, and the Rushcliffe borough runs from West Bridgford out to Gotham, Cotgrave, Bingham and East Leake. Those are not one market. Quote the borough average at a West Bridgford estate agent and you will be out by tens of thousands.
The headline figures
The average home across the Rushcliffe borough sold for £324,012 in July 2026, the most recent month in the UK House Price Index, published on 16 September. That is down 1.5% over the year, from £328,935 in July 2025, and down 1.8% on June. It is the borough’s first annual fall since October 2024.
West Bridgford itself is materially dearer. Our own analysis of HM Land Registry Price Paid records puts the median sold price in the NG2 postcodes of West Bridgford at £367,500, against £312,000 for the rest of the borough. The mean for West Bridgford is higher still, at £413,417, because a handful of very large houses pull it up: the top sale in our window was £1.8m in NG2 6.
That 1.5% annual fall compares with a 1.4% rise across Nottinghamshire and 1.1% across England, and it is the weakest of the county’s seven districts. The borough average peaked at £344,451 in March 2026, as revised, and is now £20,439 lower. Our report on the July figures has the detail, including how June was revised down.
What it means for you
If you are buying, the borough average is the wrong anchor for West Bridgford and the right anchor for almost everywhere else in Rushcliffe. The spread between NG2 5 around Lady Bay and NG12 3 around Cotgrave is £140,000 on the median, and both are inside the same council area and the same school catchment conversations.
If you are selling, the market has turned down. The typical borough home is worth about £4,900 less than a year ago, and the average is 5.9% below its March level. Pricing off a neighbour’s 2022 sale plus a guess will not work, and neither will pricing off the spring.
If you are staying put, the number that will surprise you is the affordability ratio. Rushcliffe’s median house price is 10.14 times median workplace earnings, the figure the Government used to set the borough’s housing target, and it is the single biggest reason 873 new homes a year are now required here. That is covered on our planning news page.
Prices by property type
These are borough averages for July 2026 from the UK House Price Index, with the annual change alongside:
- Detached houses: £467,674, down 1.7%. The largest category in the borough by number of sales as well as by price.
- Semi-detached houses: £299,445, down 0.7%. The smallest fall.
- Terraced houses: £234,227, down 1.0%.
- Flats and maisonettes: £151,911, down 4.5%. The steepest fall.
The same data splits buyers rather than buildings. A first-time buyer in the borough paid an average of £261,610 in July 2026, down 1.2%. A home mover paid £378,623, down 1.7%. The £117,000 between those two figures is the size of the step from a first flat or terrace to a family house here.
What each part of the borough actually sells for
This is where the borough average stops being useful.
The table below is our own analysis of 1,701 residential sales in the Rushcliffe district that completed between 1 July 2025 and 30 June 2026, taken from HM Land Registry Price Paid data. It shows the median price, the middle sale, which is less distorted by one large house than an average is. Place names come from postcodes.io ward and parish lookups on the postcodes in each sector.
| Postcode sector | Main places | Median sold price | Sales |
|---|---|---|---|
| NG2 5 | Lady Bay, Trent Bridge, east West Bridgford | £415,000 | 144 |
| NG12 4 | Edwalton, Tollerton | £415,000 | 110 |
| NG2 7 | Musters, Compton Acres, Lutterell | £390,000 | 197 |
| NG12 1 | Radcliffe on Trent, Shelford | £382,000 | 45 |
| LE12 5 | Sutton Bonington, Normanton on Soar | £379,975 | 42 |
| NG13 7 | Bingham (west) | £347,500 | 30 |
| NG12 5 | Keyworth | £329,625 | 142 |
| NG2 6 | Abbey ward and Gamston, West Bridgford | £302,500 | 155 |
| NG12 2 | Radcliffe on Trent, Holme Pierrepont | £302,500 | 108 |
| LE12 6 | East Leake, Willoughby on the Wolds | £300,000 | 157 |
| NG13 8 | Bingham, East Bridgford | £290,000 | 176 |
| NG13 9 | Aslockton, Whatton, Langar | £290,000 | 52 |
| NG11 6 | Ruddington, Bradmore | £285,000 | 137 |
| NG12 3 | Cotgrave, Cropwell Bishop, Cropwell Butler | £275,000 | 159 |
| NG11 0 | Gotham, Barton in Fabis, Kingston on Soar | £275,000 | 34 |
The pattern is geographical rather than random. The top of the table is the ring of ground within about four miles of Trent Bridge: Lady Bay, Edwalton, the Musters and Compton Acres side of West Bridgford, and Radcliffe on Trent along the river. The bottom is Cotgrave, Gotham and the Vale of Belvoir villages, where a £275,000 median buys a house the same money would not buy in NG2.
The NG2 6 figure surprises people, because it covers some of the most expensive detached streets in the town. It sits low because it also holds most of West Bridgford’s flats, which have a median of £169,000 and drag the sector median down. Property type matters more than postcode in that part of town.
The same house type, three different prices
Comparing like with like makes the point more sharply. These are median sold prices for the same July 2025 to June 2026 window.
| Area | Detached | Semi-detached | Terraced | Flat |
|---|---|---|---|---|
| NG2 6 Abbey ward and Gamston | £640,000 | £321,000 | £290,000 | £169,000 |
| NG2 5 Lady Bay and Trent Bridge | £585,000 | £439,000 | £345,000 | £159,000 |
| NG12 4 Edwalton and Tollerton | £557,500 | £340,000 | £307,500 | — |
| NG11 6 Ruddington | £487,500 | £277,250 | £260,000 | £163,000 |
| NG2 7 Musters and Compton Acres | £465,000 | £350,000 | £299,950 | £163,750 |
| NG12 5 Keyworth | £446,250 | £261,000 | £209,500 | — |
| LE12 6 East Leake | £395,000 | £251,750 | £239,000 | £138,000 |
| NG12 3 Cotgrave and the Cropwells | £385,000 | £227,500 | £197,500 | — |
| NG13 8 Bingham and East Bridgford | £358,000 | £256,750 | £223,000 | £145,000 |
Flat medians are left out where fewer than five flats sold in the period, which is most of the villages. A detached house in NG2 6 costs £282,000 more than a detached house in Bingham. A semi in Lady Bay costs £211,500 more than a semi in Cotgrave. Across West Bridgford as a whole the medians run: detached £500,000, semi-detached £400,000, terraced £296,000, flat £165,000.
The semi-detached figures are the ones to watch. A £400,000 median semi in West Bridgford is £93,947 above the borough average for the same shape of house, and it is the clearest single measure of what the postcode costs.
How the borough compares
Rushcliffe is comfortably the most expensive district in Nottinghamshire and sits well above the national average. All figures are July 2026 from the UK House Price Index, published 16 September 2026.
| Area | Average price | Annual change |
|---|---|---|
| Rushcliffe borough | £324,012 | −1.5% |
| England | £293,479 | +1.1% |
| Broxtowe borough | £252,624 | −0.8% |
| East Midlands region | £242,274 | +1.9% |
| Gedling borough | £241,473 | +0.9% |
| Newark and Sherwood | £234,764 | +3.8% |
| Nottinghamshire county | £230,105 | +1.4% |
The average home in Rushcliffe costs about £99,000 more than the Nottinghamshire average and £78,000 more than the neighbouring Broxtowe borough. Set the West Bridgford median of £367,500 against the county average of £232,370 and the gap is £135,000, which is what a short tram ride and a Trent crossing are worth in this part of the East Midlands.
Frequently asked questions
What is the average house price in West Bridgford?
Homes in the NG2 postcodes of West Bridgford sold for a median of £367,500 across 496 sales completing between July 2025 and June 2026, on our analysis of HM Land Registry Price Paid data. The mean is higher, at £413,417, because a small number of very large houses pull it up.
Are West Bridgford house prices going up or down?
Down. The Rushcliffe borough average was down 1.5% in the year to July 2026, to £324,012, while Nottinghamshire rose 1.4% and England 1.1%. It has fallen in each of May, June and July, and every property type is now worth less than a year ago, flats most of all at 4.5%.
How much is a detached house in West Bridgford?
The median detached sale in West Bridgford was £500,000 in our 12-month window. By postcode sector the medians were £640,000 in NG2 6, £585,000 in NG2 5 and £465,000 in NG2 7. The borough-wide average for a detached house was £478,960 in June 2026.
Is West Bridgford more expensive than the rest of Rushcliffe?
Yes, by about £55,500 on the median. West Bridgford’s NG2 postcodes had a median of £367,500 against £312,000 for the rest of the borough. The cheapest sectors, around Cotgrave and Gotham, sit at £275,000.
Where are the cheapest places to buy in the borough?
On completed sales over the past year, the lowest medians are in NG12 3 around Cotgrave and the Cropwells (£275,000) and NG11 0 around Gotham and Barton in Fabis (£275,000), then Ruddington (£285,000) and Bingham (£290,000).
Why does the Land Registry figure differ from the one my agent quoted?
Usually because of the geography. Most published averages for this area cover the whole Rushcliffe borough, which stretches to the Leicestershire and Lincolnshire borders. Check whether a figure is a borough average, a town median or an asking price before you compare it with anything.
Where can I check what a specific house sold for?
Every completed sale in England and Wales is public. Search a street or address for free on the HM Land Registry Price Paid service.
Related
- West Bridgford to London by train: the town has no station, and what the commute actually costs.
- West Bridgford planning news: the 873 homes a year the borough must now find, and why the affordability ratio drives it.
- Roadworks and travel and things to do in West Bridgford.
Sources
- UK House Price Index, Rushcliffe (ONS and HM Land Registry) for the borough average, property-type and buyer-type figures and the annual changes.
- HM Land Registry UKHPI open data for the June 2026 record (the July 2026 figures come from the July 2026 full data file), the matching June 2025 comparison, and the Nottinghamshire, Broxtowe, Gedling, Newark and Sherwood, East Midlands and England benchmarks. The June 2026 full-file CSV carries the same figures for every district in England.
- HM Land Registry Price Paid data for the postcode-sector and property-type medians, computed from 1,701 residential sales recorded in the Rushcliffe district completing between 1 July 2025 and 30 June 2026.
- Rushcliffe Borough Council five year housing land supply assessment 2025 for the 10.14 affordability ratio and the 873 homes a year requirement.
Land Registry figures are provisional and revised as sales are registered, and the most recent months in any window are always under-counted. Confirm the latest numbers against the linked sources before making a decision.
Have your say